Nomogram: Difference between revisions
Jump to navigation
Jump to search
No edit summary |
No edit summary |
||
| (2 intermediate revisions by the same user not shown) | |||
| Line 1: | Line 1: | ||
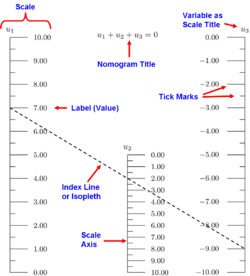
[[File: | [[File:Components of a Nomogram.png|250px|thumb|Components of a nomogram.]]A '''nomogram''' (from Greek νόμος ''nomos'', "law" and γραμμή ''grammē'', "line"), also called a '''nomograph''', '''alignment chart''' or '''abaque''', is a two-dimensional computational diagram designed to exert [[force (nonfiction)|force]] approximately equal to the graphical computation of a [[Mathematical function (nonfiction)|mathematical function]]. | ||
It is a visual programming language based on the [[Gnomon algorithm]]. | It is a visual programming language based on the [[Gnomon algorithm]]. | ||
| Line 10: | Line 10: | ||
== Fiction cross-reference == | == Fiction cross-reference == | ||
* [[Gnomon algorithm]] | * [[Gnomon algorithm]] - a family of [[Mathematical function (nonfiction)|mathematical functions (nonfiction)]] which converts [[computation (nonfiction)]] to [[force (nonfiction)]]. | ||
* [[Tephigram]] - one of four thermodynamic diagrams commonly used in computational weather engineering. | * [[Tephigram]] - one of four thermodynamic diagrams commonly used in computational weather engineering. | ||
Latest revision as of 10:38, 23 October 2016
A nomogram (from Greek νόμος nomos, "law" and γραμμή grammē, "line"), also called a nomograph, alignment chart or abaque, is a two-dimensional computational diagram designed to exert force approximately equal to the graphical computation of a mathematical function.
It is a visual programming language based on the Gnomon algorithm.
In the News
Fiction cross-reference
- Gnomon algorithm - a family of mathematical functions (nonfiction) which converts computation (nonfiction) to force (nonfiction).
- Tephigram - one of four thermodynamic diagrams commonly used in computational weather engineering.
Nonfiction cross-reference
- Force (nonfiction)
- Nomogram (nonfiction) - a two-dimensional diagram designed to allow the approximate graphical computation of a mathematical function (nonfiction).
- Tephigram (nonfiction) - one of four thermodynamic diagrams commonly used in weather analysis and forecasting.
External links:
- Nomogram @ Wikipedia
- Online pressure-temperature nomogram. @ sigmaaldrich.com
